PHYSICS ENGINE V1 / NS–0003
A CFD decision
you can inspect.
The 161 × 41 body-fitted mesh is frozen for the parametric AI dataset. Compare three grids, inspect solver evidence, and follow the path from verified physics to CFD-confirmed designs. This public snapshot includes the results; linked GitHub source files require collaborator access.
axial × radial grid points
Fit for the declared 2D axisymmetric dataset. Wall shear retains a measured mesh-sensitivity qualification.
01 / MESH SENSITIVITY
Why the medium mesh?
Choose an output to compare all three solver runs. The highlighted grid is used for routine dataset generation; the fine grid is the sensitivity reference.
Pressure drop
Pressure drop shifts less than one percent. This supports the production mesh for the declared engineering use.
| Grid | Points | Iterations | Pressure drop | Continuity (kg/s) | Decision |
|---|
02 / EVIDENCE & PROGRESS
From solver to decision.
Inspect the selected case's verification gates, then compare its results with the independently confirmed OPT1–001 candidate. All figures are generated by the repository solver.
Geometry, mesh & solution
The case switch above changes the four solver figures. Both cases stay visible in the profiles for direct comparison at the same flow rate.
Axisymmetric annular fluid domain and device shape.
Production grid · 161 axial × 41 radial points.
Solver-produced pressure field; refer to each figure’s color scale.
Solver-produced speed field; the profile below plots axial velocity uz.
Pressure along the device
Radial-cell arithmetic mean at each stored axial cell center.
The difference between the first and last cell means matches the recorded pressure drop (846.26 and 752.93 Pa). Verification source ↗
Axial velocity uz
Compare both cases at a stored cross-section nearest the selected axial position.
Cell centers only; no interpolation to the walls.
Profiles are derived from each run’s baseline and OPT1–001 saved field data. Lines connect stored cell values for reading; no values were simulated in the browser. These are numerical CFD results, with external validation still pending.
Convergence history
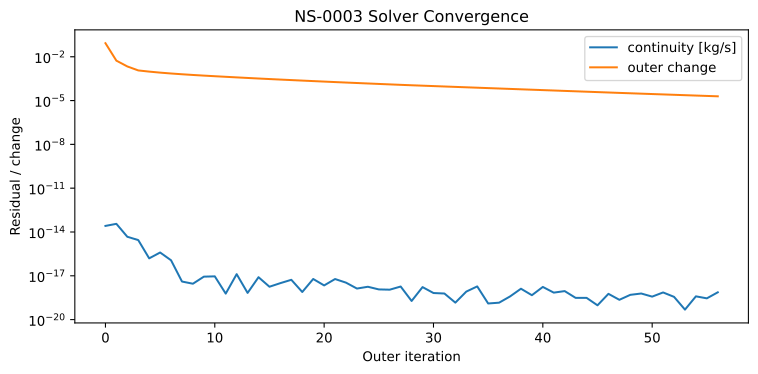
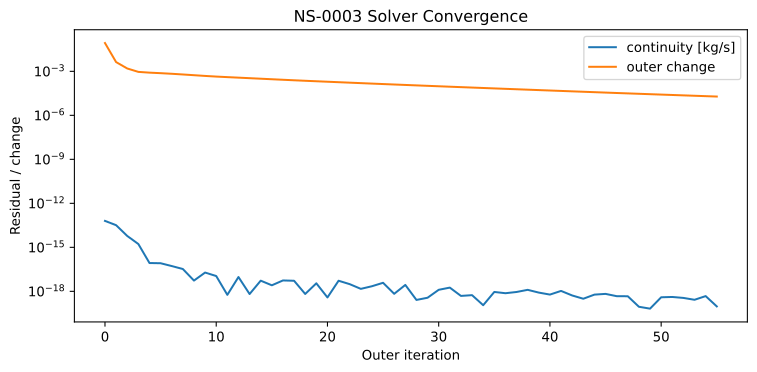
Both runs passed the recorded solver gate. Figure axes may differ; compare numeric outputs at right.
Measured CFD response
OPT1–001 relative to the frozen baseline. Both use 100 mL/min flow; changes reflect the recorded geometry and solver results.
WSS differences are numerical model outputs and retain the mesh-sensitivity qualification.
Validation matrix · frozen baseline
| Check | Criterion | Observed | Status | Evidence |
|---|
What the evidence supports
Know which results you are seeing.
This dashboard is a manually prepared snapshot. New GitHub commits do not change the figures or numbers until the dashboard source is reviewed and redeployed. The source repository is private; its evidence links require collaborator access.
- Evidence snapshot
- 23 Sep 2026
- Evidence commit
695403bf↗- Physics model
- NS–0003 · Engine v1
- Production mesh
- 161 × 41 body-fitted
- Dashboard code
- Private GitHub copy ↗
- Refresh status
- Static snapshot · manual review